- Blog
Behind the Metrics: Month-over-Month Campaign Optimization

Cybersecurity Content Specialist
Today we´re looking at a month over month campaign comparison. Over two months, we tracked key metrics in a programmatic campaign to see how things changed before and after the first step of optimization. The results showed clear progress in some areas, while others still had room for improvement.
Here’s what the data revealed:
Invalid Impressions: A Significant Drop
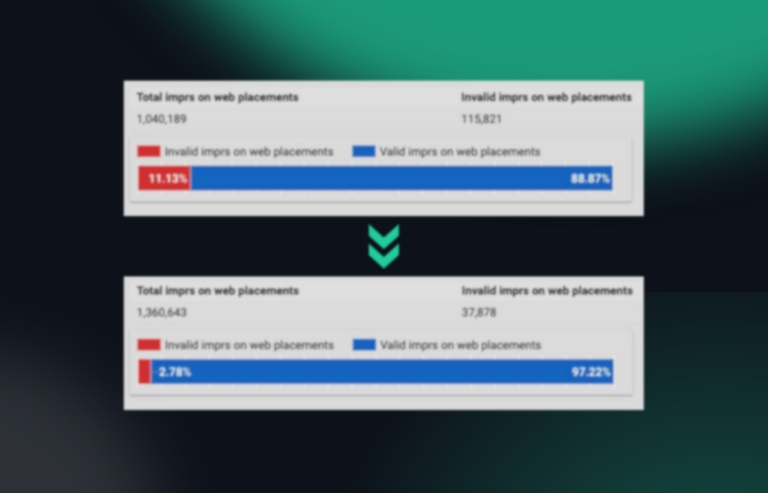
In the first month, 11.3% of impressions were invalid. Through optimization, a month later, this figure was reduced to 2.78%, marking a substantial drop by 75%.
As you can see small changes already have a massive impact, now it is time to tweak the campaign to get the low invalid impression rate even further thrown, this however takes time.

Viewability: The Improvement Shiftet the Task
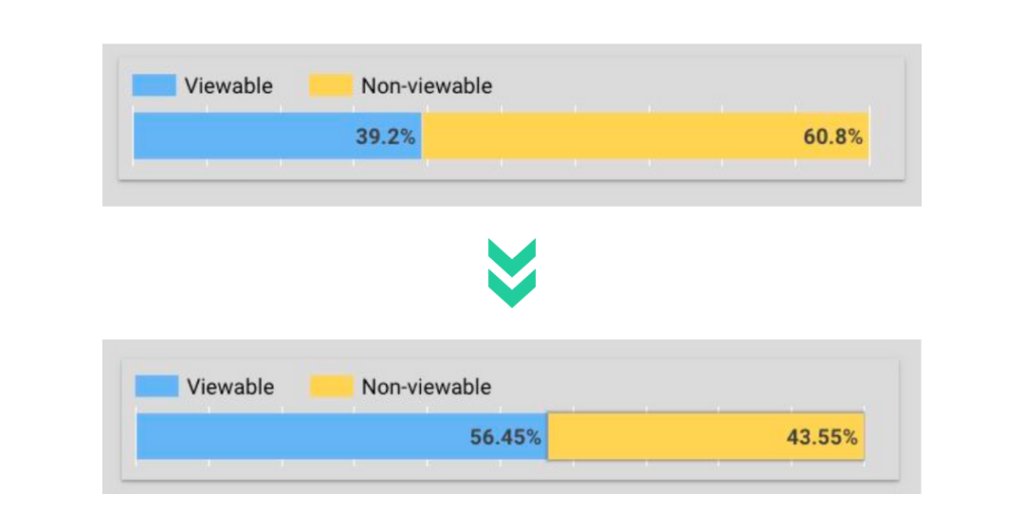
In the first month, the viewability rate was at 39%, meaning that more than 60% of placements were never actually seen; which meant this definitely has to be optimized.
By the second month, viewability had improved to 56%. A significant step forward, however this still has to be further worked on and ongoingly optimized. Now, more ads were viewable. But a new topic came into focus: MFA sites. Let’s take a look.
MFA Sites: A Growing Challenge That Requires Constant Monitoring
I’m sure you´re aware of what MFA sites are. If not, take a look here. So you also know that MFA sites are not fraud and bad per se, but still aren’t always the place where you want to see your ads.
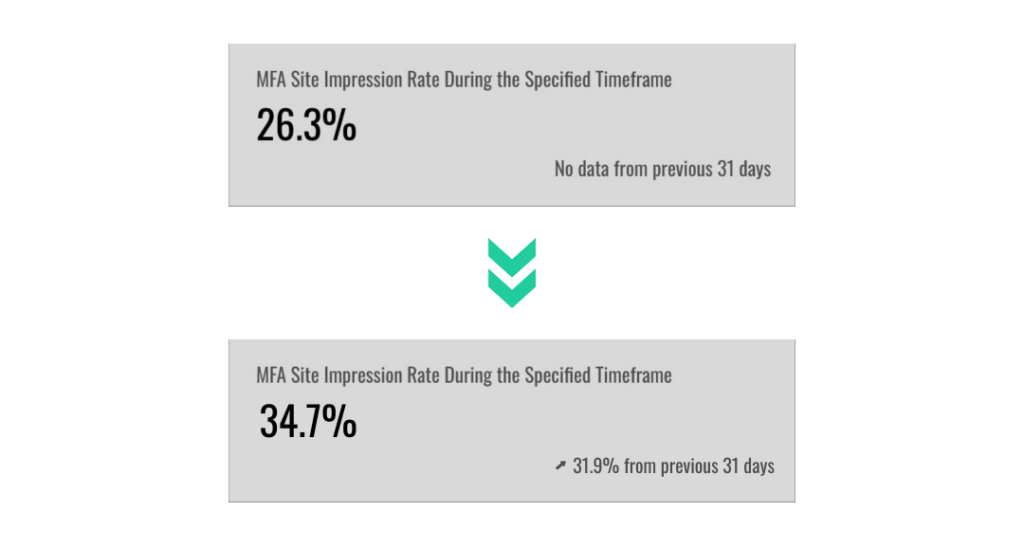
In the first month 26% of impressions landed on MFA sites. By the second month, this number had increased to 35%. Is this necessarily a bad thing though?
No, like mentioned before not all MFA sites are inherently bad. While MFA sites are often flagged as low quality, some attract real traffic and drive engagement. The classification is based on ad slots per page, meaning that sometimes even premium publishers are included.
Instead of blocking them all, advertisers should assess whether they add value and bring legitimate traffic or just waste ad spend. For some campaigns the advertiser can also consider using inclusion lists to just run on websites that he wants to see his ads on.
Country Targeting: Consistently Strong Performance
Country targeting was highly accurate, with nearly 100% of impressions in Germany. This aspect was already well-executed, great job!

SSPs: More Is Not Always Better
By the second month, 74 SSPs were in use, already marking an improvement of 17.5%. But this isn’t the end of optimization as some placements through certain SSPs delivered over 50% invalid impressions, with a few showing up to 100% invalid.
As you can see from the previous points, the campaign had better performance even with less SSPs being used, meaning quality over quantity is the way to go.
Conclusion: The Ripple Effect of Optimization
This case highlights how campaign optimization is a dynamic process. Improving one metric often impacts others. Cutting invalid impressions by 75% and increasing viewability by 44% were clear wins, but they also shifted focus to new challenges, like the rise in MFA site impressions. Instead of blocking them outright, a more strategic evaluation is needed.
Similarly, reducing the number of SSPs led to better performance, proving that quality matters more than quantity. This campaign demonstrates that optimization is never a one-time fix but an ongoing balancing act, where every improvement creates new areas to refine. Staying agile and data-driven is the key to long-term success.

Learn everything you need to know about Invalid Traffic in 2024 based on our customers’ data. Including a breakdown into marketing channels, industries and much more.
- Published: April 2, 2025
- Updated: April 2, 2025
1%, 4%, 36%?
