- Blog
How to detect Invalid Traffic using your own analytics

Oliver Kampmeier
Cybersecurity Content Specialist

It is estimated that 17% of all ad clicks are fake and 57% of all internet traffic is generated by bots. This number is likely to increase in the coming years. That is a lot of money advertisers lose every year to click fraud.
The big question is: Can you detect bot traffic and optimize your ad campaigns simply by using your own analytics? We definitely think so! Detecting and preventing click fraud and bot traffic is not difficult if you know what to look for and what metrics should set off alarm bells.
With this article, we want to provide you with a detailed guide that focuses on bot traffic detection and optimizing your ad placement to get the most out of your campaigns.
What you need to detect bot traffic and optimize your campaigns
You don’t need much to identify fake traffic and develop a strategy to optimize your ad placement. In fact, almost every company should already have the data they need at their fingertips, they just do not look closely at the numbers.
To get the most out of this guide you need:
- A Google Analytics account or any other comparable analytics tool
- Access to your server log files
- Reports from your DSP
- Reports from your ad server
- Excel or Google Sheets to combine the data from different sources
We will focus on Google Analytics as it is the most widely used analytics solution on the web with over 55% market share (Google Analytics and Google Universal Analytics combined). But of course, you can also take your already implemented analytics solution, you just need to look for comparable metrics. We also have screenshots of other tools to give you an idea of what to look for.
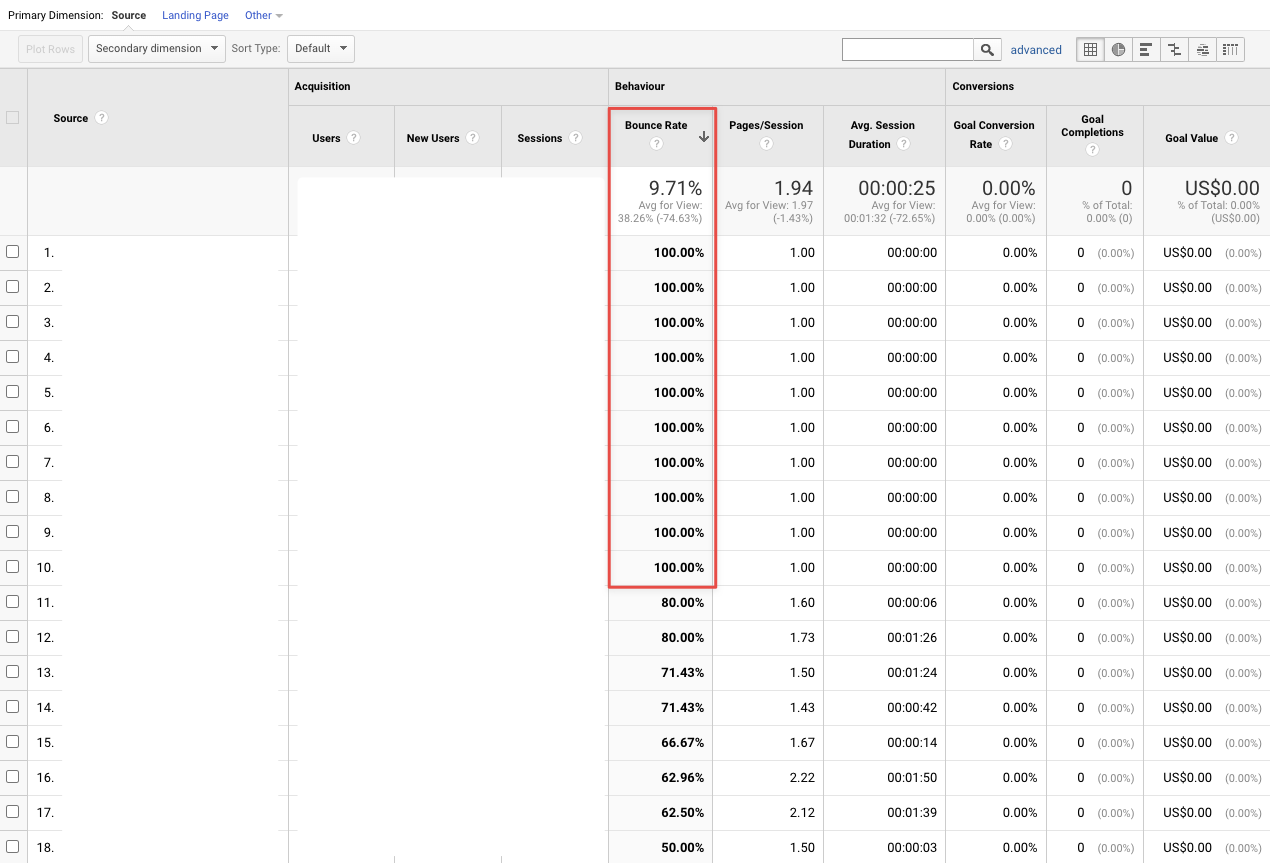
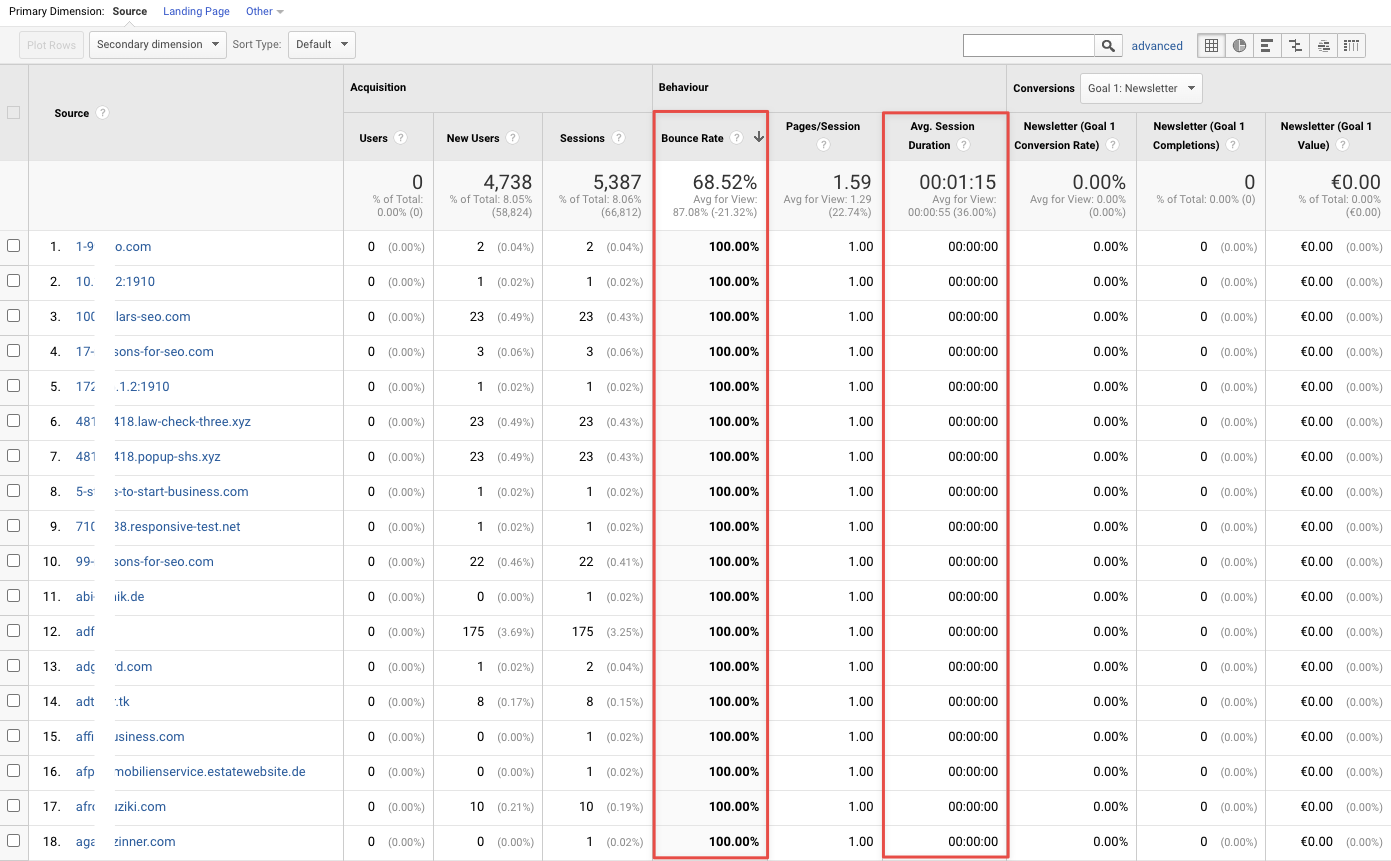
Indicator #1: Bounce rate is close to 0% or 100%
Google defines bounce rate in its Google Analytics as “a single-page session on your website […] that triggers only a single request to the Analytics server” (Google). So, if a user visits a page and then leaves without triggering another request to the Analytics server during that session (e.g., by visiting another page or triggering an event such as a download, etc.), that visit is considered a bounce. Your total bounce rate is the percentage of all sessions that are bounces.
But how can you detect bots based on bounce rate, you may ask? Good question! Human audiences do not behave exactly the same. Some bounce within a few seconds, others after a few minutes, and still others either trigger an event like a conversion or visit other pages on your website.
Bots, on the other hand, are programmed to do exactly the same task and behave in the same way over and over again. It’s difficult to give an average bounce rate for an ad campaign because it depends on a variety of factors such as industry, page experience, and many others, but anything below 30% and above 70% should make you take a closer look at your analytics and investigate.
In most cases, bots leave your site immediately, leaving you with a bounce rate of 100%. In other, more sophisticated cases, bots visit a certain number of other sites during their session to disguise the fact that they are a bot. But because they have been programmed to do this one thing over and over again, you will quickly see a pattern if you look closely at your data.
In both cases, the bot behavior leaves you with bounce rates close to 0% and 100%.
How to look up overall bounce rates in Google Analytics
- Go to the “Audience” page on the left
- Click the “Overview” page to get an overview of your overall bounce rate
How to look up bounce rates of specific pages in Google
Instead of looking at your website’s overall bounce rate, dive deeper and look at specific pages. This could be the landing page for your advertising campaign, for example.
- Go to the “Behavior” page on the left
- Click the “Site Content” → “All pages” page
- Search for the page you want to have a closer look at
How to look up bounce rates based on referring domains in Google Analytics
If you want to take a detailed look at your referring domains, follow the steps below:
- Go to the “Acquisition” page on the left
- Click the “All Traffic” → “Channels” page
- Select “Referral” and you will get a list of all referral domains together with their bounce rates. Look for outliers within the list. If a domain only sends you traffic that has a bounce rate of almost 100%, the visitors from that domain are most likely not legit.
If you come across domains that have questionable metrics, you should think about excluding them from displaying your ads.
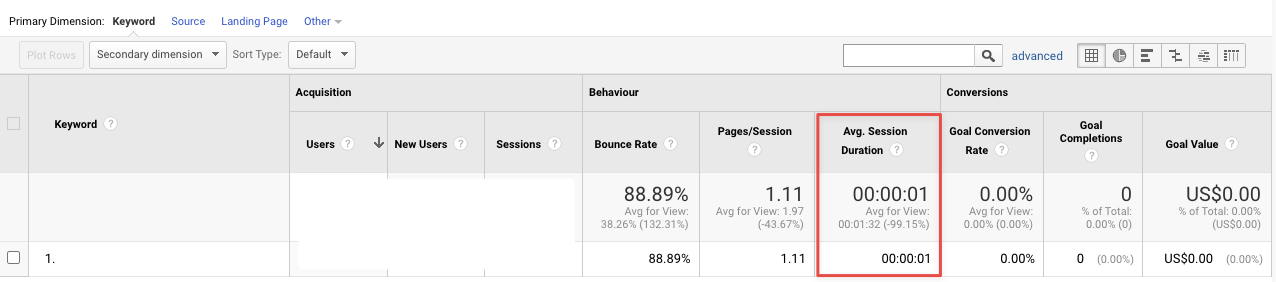
Indicator #2: Average session duration is close to 0 seconds
“A session is a group of user interactions with your website that take place within a given time frame. For example a single session can contain multiple page views, events, social interactions, and ecommerce transactions” (Google).
Since the main purpose of bots clicking on your ads is to bring money to the fraudsters, once the click on the ad has taken place, the bots have completed their task. Therefore also the very high bounce rate. The bots are not interested in staying on your website because they might already be clicking on the next ad to generate even more money. However, real visitors stay on your site for at least a few seconds in most cases, so you can even raise the average session duration threshold to at least a couple of seconds to distinguish between real and fake traffic.
Bot traffic that has close to 100% bounce rate in most cases also has an average session duration of 0 seconds, as the bot leaves your page immediately after clicking on your ad. Look for sessions in your analytics data that were too short to be a real person.
How to look up average session duration in Google Analytics
- Go to the “Audience” page on the left
- Click the “Overview” page to get an overview of your average session duration
How to look up average session duration of specific pages in Google Analytics
Similar to the bounce rate, you want to have a more in-depth look into the average session duration of your landing pages:
- Go to the “Behavior” page on the left
- Click the “Site Content” → “All pages” page
- Search for the page you would like to have a closer look at
How to look up average session duration based on referring domains in Google Analytics
Google Analytics also gives you the average session duration based on the referring domain. This could be a good indicator for domains that buy bot traffic compared to other referrers with real human traffic.
- Go to the “Acquisition” page on the left
- Click the “All Traffic” → “Channels” page
- Select “Referral” and you will get a list of all referral domains together with their average session duration. Look for outliers within the list.
Again: if you stumble across domains that have very low average session duration (close to 0 seconds), you should consider excluding them from displaying your ads.
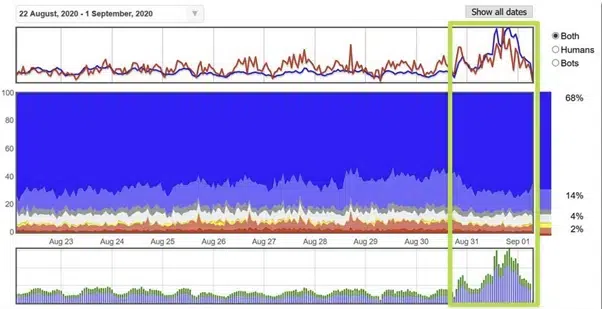
Indicator #3: Unusual traffic patterns
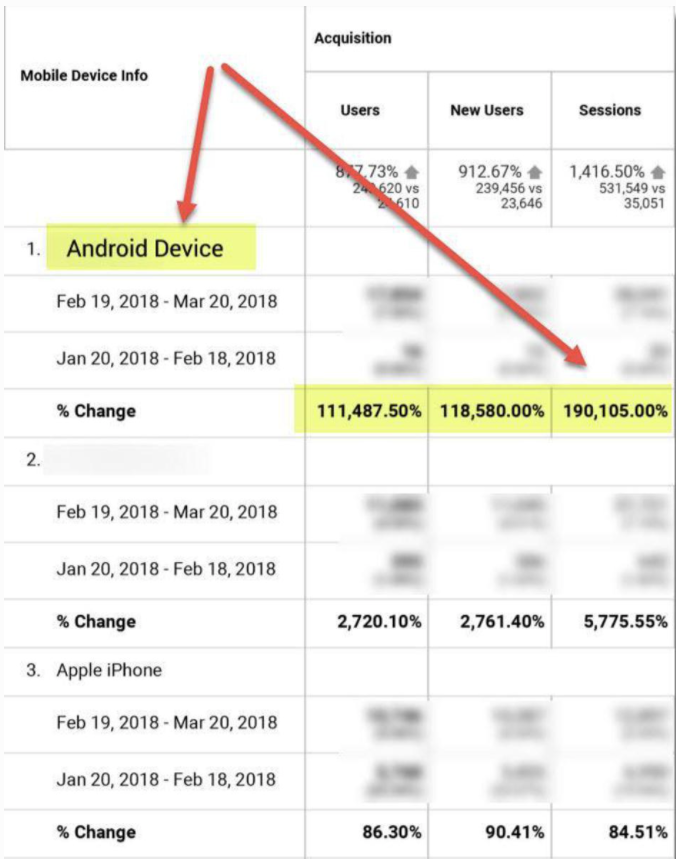
During your campaigns, also watch out for unusual traffic spikes and patterns. If your website normally gets 10,000 visitors per day and suddenly gets 50,000 without you changing anything or doing anything else, this should be an alarm signal.
Look for spikes on a particular day or series of days and look again at the behavior metrics. If the influx of new visitors has very high bounce rates and a very low average session duration, it is most likely bot traffic.
Often you will see traffic peaks at the end of a month – the so-called “end of the month traffic fulfillment”. Some websites guarantee their buyers a specific amount of traffic and therefore ad impressions. If they are running behind on their numbers at the end of the month, they turn to bot traffic to fulfill their obligations. Compare the last couple of days of a month to a previous time period to detect spikes in traffic.
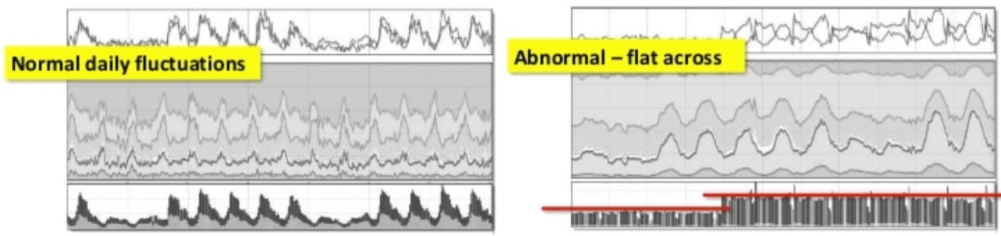
Also have an in-depth look at the hourly data for several days. As a rule, visitors do not visit your website at night as often as during the day. So if you keep noticing peaks at unusual times, you should take a closer look at where the traffic is coming from and why your advertising budget is being “wasted” in the middle of the night.
The same is true not only for traffic spikes in your analytics, but also for flat patterns. Hourly data with real human traffic is bell-shaped. This means that traffic starts in the early morning hours before peaking at noon and leveling off again towards evening. If you see a flat line throughout the day, there is something wrong with your traffic and it is most likely not coming from real people.
Indicator #4: Unusual geolocations
Your business operates in the US, but you receive a lot of traffic from developing countries like India and Bangladesh? You could be the victim of a click farm or botnet operating from these countries.
Keep a close eye on where traffic to your landing pages is coming from. In most cases, this is easier said than done, as fraudsters nowadays use US data centers and proxies to make traffic look like it is coming from residential homes in any Western country. However, if you notice traffic from countries that are not your primary market, you should definitely add negative targeting to reduce the display of your ads to those users.
In some cases, you need to examine your geolocation reports more closely, as bot traffic can originate from seemingly legitimate locations as well. The following image shows locations of devices in the Greater London area that look like a perfect rectangular grid when zoomed out.
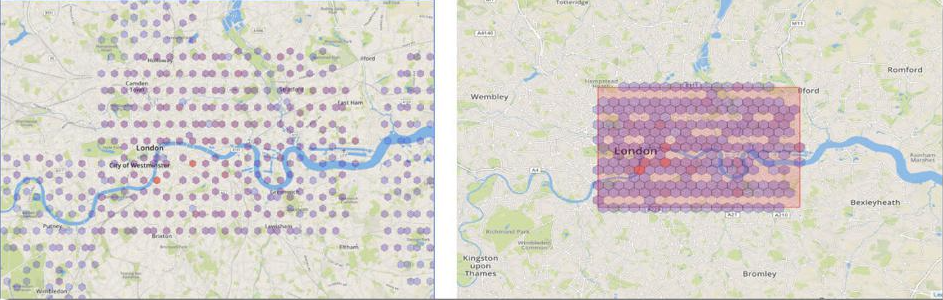
“These are just faked lat-longs passed by fraudulent apps on real devices, or by fake mobile devices in datacenters – software emulators that simulate various aspects of a smartphone, including its location.” (Dr. Augustine Fou)
For more info on how botnets, autoclick software and click farms operate, have a look at our article: 7 tools and tactics used for ad fraud.
How to look up the geolocation of your visitors in Google Analytivs
- Go to the “Audience” page on the left
- Click the “Geo” → “Location” page to get an overview of the geolocation of your visitors.
In this report, you also get metrics like bounce rate and average session duration for each country and can act accordingly. In addition to country, you can also add either landing page or referrer as a secondary dimension, which helps you narrow down invalid traffic even further.
Indicator #5: Duplicate IP Addresses in your log files
There was once a time when it was obvious that you were a victim of click fraud if you kept seeing the same IP addresses in your log files. Nowadays, bot developers are getting smarter, using proxies and constantly changing their IP addresses or even infecting users’ devices with malware and hijacking them to commit click fraud.
So, this might not be your top priority, but you should still take a look at your log files occasionally and check for duplicate IP addresses that keep clicking on your ads. While humans might well click on your ads multiple times a day, you should block all IP addresses that exceed a certain threshold (e.g., 5). It is very unlikely that a human will click on the same ad more than a few times. People either convert or lose interest in your product or service.
To access and analyze your log files, you might need to speak with your IT department. If you find duplicate IP addresses in your log files, you should exclude them from displaying your ads.
How to exclude IP addresses from Google Ads
Google has an in-depth page about how you can block IP addresses in Google Ads from seeing your ads. Following the most important steps:
- Sign in to your Google Ads account.
- In the page menu on the left, click Settings.
- Select the campaign you’d like to exclude IP addresses from.
- Click to expand the “IP exclusions” section. (Click Additional settings if you can’t see the “IP exclusions” section.)
- Enter the IP addresses you want to exclude from seeing your ads.
- Click Save.
Indicator #6: Unfamiliar referral traffic
Another indicator of fake traffic are unknown referral sources. It is understandable that most referring domains in your report will be unknown to you. However, some fraudsters set up websites with gibberish domain names or numerous numbers in them. So, pay attention to anything that is immediately noticeable in your report.
Often, you will also find a whole bunch of websites in your report that you cannot even visit as a human because the domain is only used for ad serving purposes and has no public content that a human can consume.
You get several other metrics for a referral domain in Google Analytics, such as bounce rate and average session duration, which can help you filter out the bad sites faster. In order to avoid wasting a large part of your advertising budget, you should check your referral domain report regularly, i.e. 1 to 2 times per month.
In addition to your own analysis, request a placement report from your media agency listing all the domains (and apps) where your ads were allegedly displayed. Sort them in descending order by the number of impressions and then review them individually. If you find a questionable or non-public domain, you should block ad placement for that domain.
How to look up referring domains in Google Analytics
- Go to the “Acquisition” page on the left
- Click the “All Traffic” → “Channels” page
- Select “Referral” and you will get a list of all referral domains together with their average session duration and bounce rates. Look for outliers within the list and verify each domain for legitimacy by visiting it but be careful of malware!
Indicator #7: Very high click-through rates (CTR)
Display ad click-through rates vary slightly by industry, but the average click-through rate for the Google Display Network (GDN) across all industries in 2020 was 0.47%. Similar numbers were published by WordStream in 2018: they found that the average click-through rate for GDN in 2018 was 0.46%.
Google Display Network is the largest global display network and reaches 90% of internet users worldwide, so these figures are basically a benchmark for display advertising.
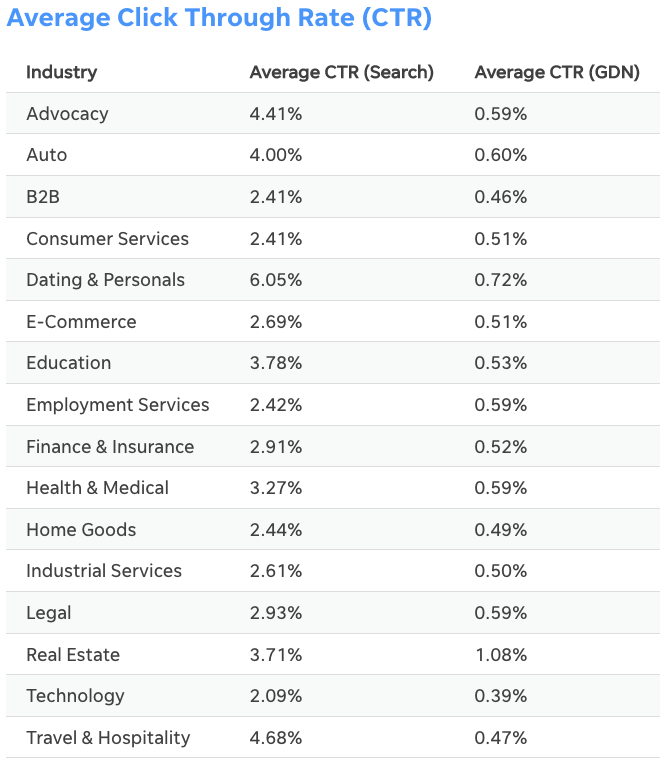
It should be noted that it is not clear to what extent these figures have been adjusted for bot traffic. The average CTR for real human traffic could be and very likely is much lower!
With these numbers in mind, you should now review your placement reports from your demand-side platform (DSP) or ad server. Any referrer domain that has a significantly higher CTR than the one you see in the image above should be investigated. In some cases, referrer domains have a CTR of up to 100%, which should immediately set off alarm bells for you!
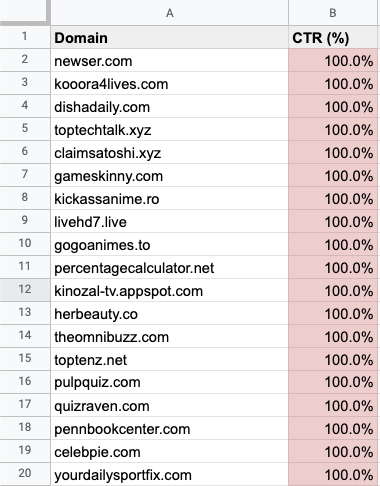
After you have examined all the websites, you should put them on a block list and stop buying ads from them.
Indicator #8: Campaign report anomalies
In order to track your ad campaign’s performance, you most likely use some sort of URL parameters. These can be either Google’s own UTM parameters or a couple of custom parameters attached to your landing page’s URL. In both cases you should have a look at your campaign reports and filter for the parameters. Next you want to compare all parameters that brought you traffic with the ones you actually set up.
In some cases, bots visit your site with URL parameters attached, that were not set up by you in the first place. So how come you get traffic to those URLs?
How to filter for UTM parameters in Google Analytics
- Go to the “Acquisition” page on the left
- Click the “Campaigns” → “All Campaigns” page
- Here you can filter for all UTM parameters like “Campaign”, “Source”, “Medium” etc. Any parameter that brought you traffic but was not set up by you is most likely fake traffic.
Indicator #9: Abnormal data consistency across different metrics
Independent Ad Fraud Researcher Dr. Augustine Fou has a saying: “When things are too high, or too low, or too consistent, you need to look into it.”
We already mentioned high bounce rates, low average session durations and unusual traffic patterns as individual metrics to keep an eye on. For the following bot traffic indicator, we look at combined metrics for your referring domains.
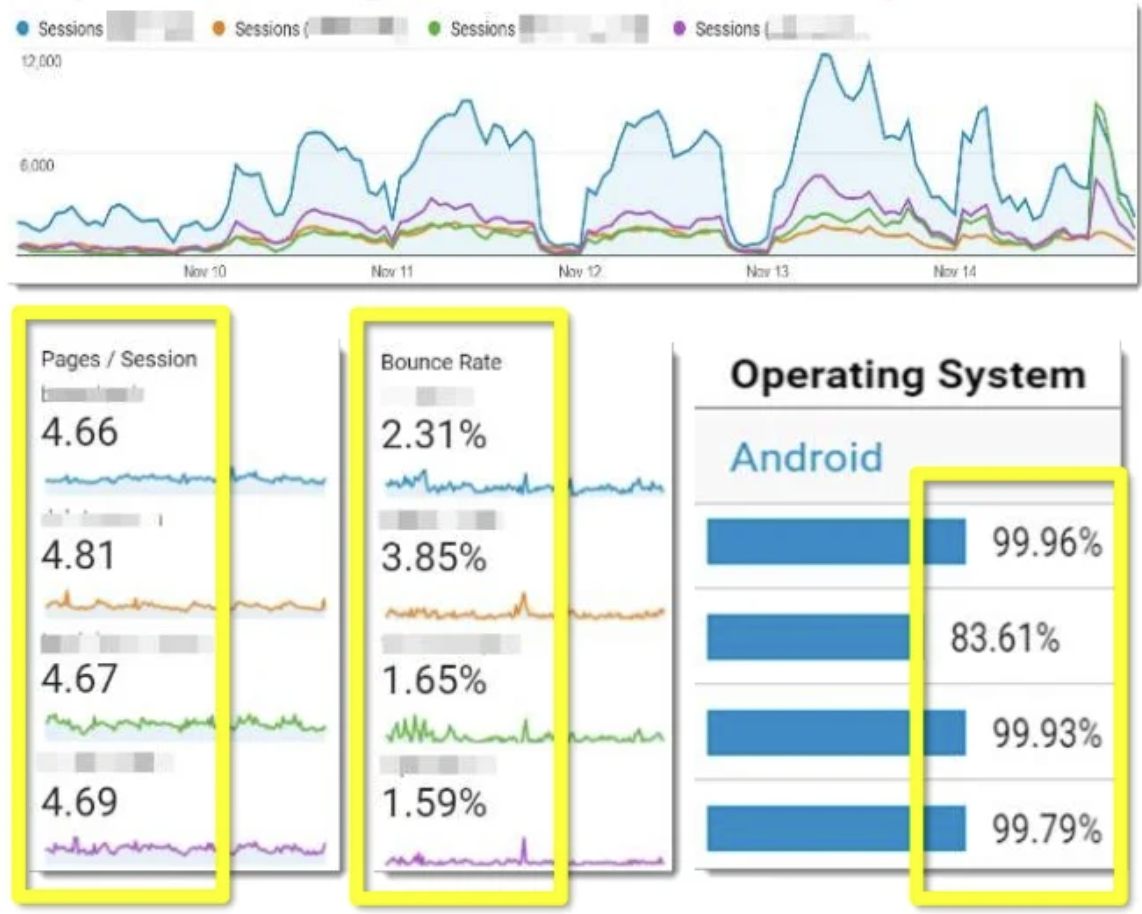
The image above shows you an example of 4 referring domains where, strangely enough, all users behave exactly the same way and have very similar patterns:
- They visit about 4.7 pages during a session
- Very low bounce rate
- Everybody uses Android
It does not take much mental effort to come to the conclusion that these websites are sending you fake bot traffic that is programmed to behave just like that. The combination of different metrics you should keep an eye on is limitless. It could be a specific browser type in combination with a specific geolocation, or a specific screen resolution in combination with a specific average session duration.
Anything that is consistent over a period of time should be investigated to avoid wasting your advertising budget. Start examining and working with the data you already have, and you will start to see those patterns, too.
Indicator #10: Super high win rates
In advertising, win rate measures the number of ad impressions won over the number of ad impressions you have bid on (Adotas). As often numerous advertisers bid for an ad space, win rates are usually in the 10% range.
Check with your DSP to see what the win rates are for each domain, or get a list from your media agency. Win rates that are significantly higher than 50% should make you skeptical, and you should take a closer look at the domain, as it is most likely fraudulent. For example, fraudsters may participate in ad stacking, where multiple ads are placed on top of each other. In this case, your ad will be displayed somewhere between other ads and will never be shown to real users.
Sort the list in descending order of impressions won and check any domain with absurdly high win rates. Add these domains to your block list to prevent them from continuing to display your ads.
Indicator #11: More ad bids won than ads served
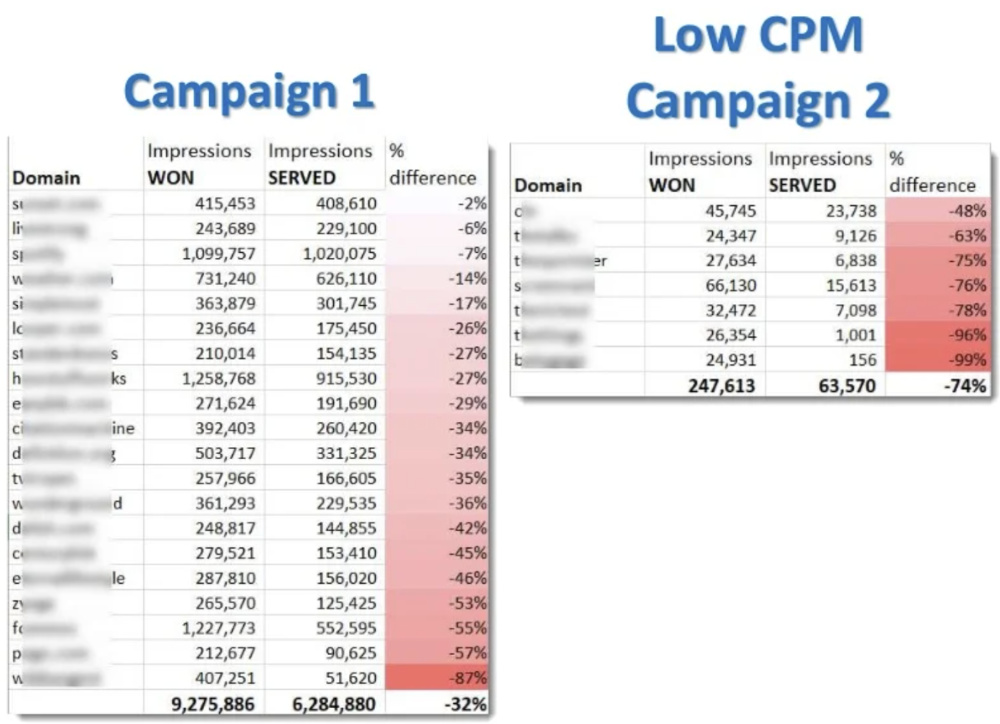
Would it not be suspicious if you won all the bids for a domain, but none of your ads ever appeared on that domain? Absolutely, because for every winning bid there should normally also be an ad served – a 1:1 ratio. However, in some cases you will notice that some domains report you thousands of won bids, but only a fraction of served ads.
In order to check the ratio of your campaigns, compare your DSP report of bids won by domain with the report from your ad server. Look for discrepancies where the ad impressions served are far below the bids won. If the difference is more than 10-15%, you should check the domain and possibly add it to your block list.
Indicator #12: Ad serving volume by hour
Similar to indicator #3, you should not only pay attention to traffic spikes in Google Analytics, but also look at the hourly data from your ad server. Pay particular attention to the time of day when most of your ads were served. If your ads are mainly served during the night hours, most of your budget is already wasted in the morning and you have no impressions left for the day.
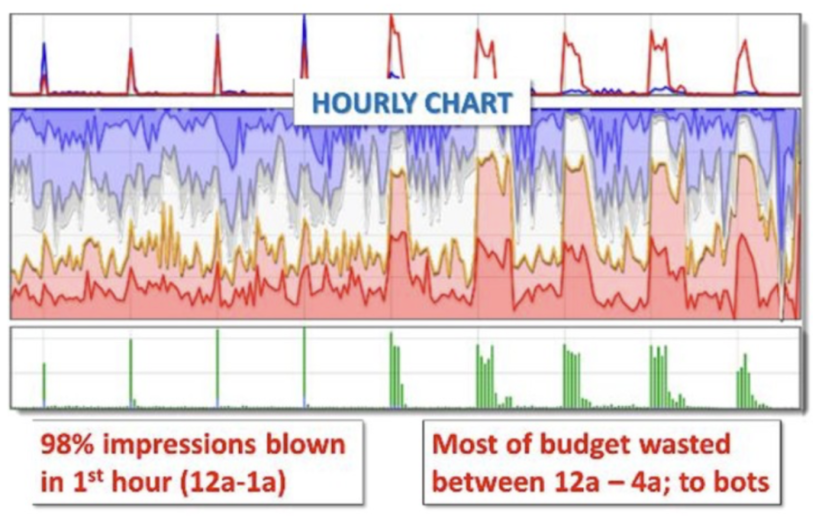
To stop this from happening, you can either stop your ad delivery completely during certain hours (e.g., 10PM – 6AM) or put a frequency cap to the ad delivery on specific domains.
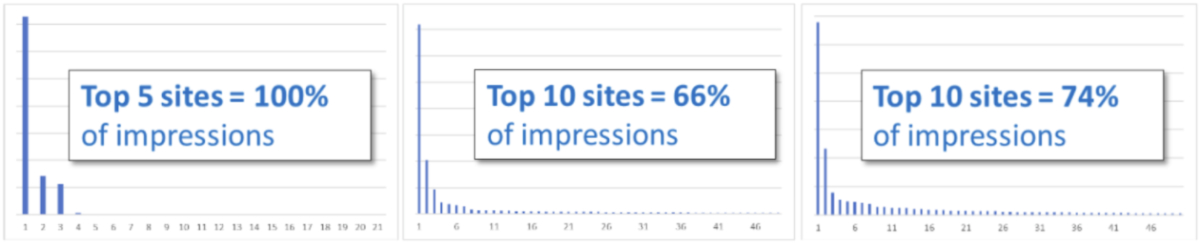
Indicator #13: Ad serving volume by domain
How would you feel if you knew that your ads were mainly displayed on a handful of domains? You probably would not be very happy about this, as it would extremely limit your reach and heavily concentrate on the audiences of these few domains. Unfortunately, it often happens that only a few domains are responsible for the majority of ads served.
To understand how many different domains are actually displaying your ads, you need to look at your ad server reports by domain. Look at the distribution of the top ad serving domains. If only a few domains are serving the bulk of your ads, consider limiting the frequency / quantity of those websites to ensure your ads reach a larger audience.
Indicator #14: Ads served to the same devices
As we mentioned in the previous indicators, most bots are programmed to do the exact same thing over and over again. The same applies to the technology underlying the bots with which they click your ads – the browser engine.
Bots do not use a browser like humans do. They do not need a graphical user interface (GUI) because they interpret the code directly. As a result, bots often use “headless” browsers – a web browser without a graphical user interface that is executed through a command line interface or via network communication. No person interested in your product or service would ever visit your website using a headless browser.
Therefore, you should definitely check the user-agents of your traffic regularly. Most headless browsers send the “headless” information with their user agent by default. Here you can find a list of known headless user-agents.
But bot developers are smart people, so they either change the user agent or use emulation tools to emulate real devices. With normal-looking user agent strings, it will be harder for you to detect bots, but not impossible.
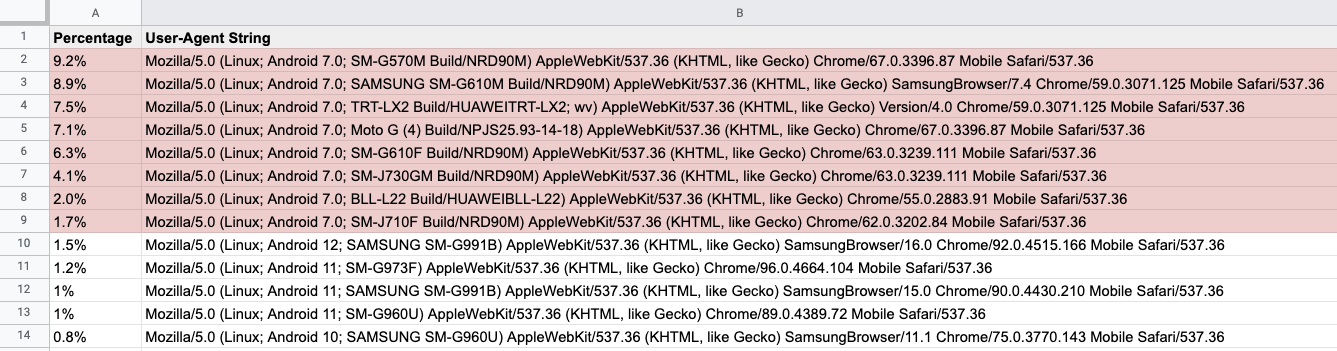
Look in your analytics or log files for anomalies. This could be either an influx or a high concentration of user agents, such as an older Android version that is responsible for a significant portion of your daily traffic. Even though Android does not have such a strict update policy as iOS, the majority of users use the latest versions, so it is very unlikely that you will receive a large amount of traffic from older devices.
With that in mind, look for two things in your analysis and log files: User agents that indicate a headless browser, and a high volume of unlikely user agents (exotic browsers, outdated operating systems, etc.). Next, you want to find out where these users are coming from and block the domain from further displaying your ads.
Indicator #15: Referrers with zero conversions
The last thing you want to do to stop bot traffic and optimize your ad placement is discover referring domains that send you traffic that simply doesn’t convert. If a referrer sends you thousands of visitors per day, but the conversion rate is 0.0%, it is most likely bot traffic.
Look up the conversion rate of your referrer domains in Google Analytics. Identify poor performing domains and add them to your block list. Monitor your conversion rates closely to see if there is any change after blocking these domains. If nothing changes and your overall conversions stay the same, all the traffic was fake and you can leave the websites on your block list.
You have a lot of data at hand – you just have to use it!
Hopefully, we could give you some tips and tricks on how to detect fake bot traffic and optimize your ad delivery with your existing analytics data. Most bot traffic is obvious if you know what to look for, you just have do some groundwork and start digging.
We are confident that if you follow these steps, your ad performance will improve dramatically. Remember: Do not rely on executive summaries from your media agencies, DSPs or ad servers. Always request the complete raw data you can work with!
If you need professional help fighting fake traffic and no longer have to worry about wasted advertising budget, contact us today or sign up for a free trial.
- Published: March 17, 2022
- Updated: July 2, 2025


1%, 4%, 36%?