Data doesn’t lie. And when you dig into in-ad campaign reporting, you find insights that challenge assumptions.
We ran an example programmatic campaign with a client, analyzing 1.4 million ad impressions across web placements only, no app traffic. The goal was to track validity, viewability, and placement quality. The results? A mix of progress, red flags, and (unsurprisingly) some cases of ad fraud.
Here’s what we found.
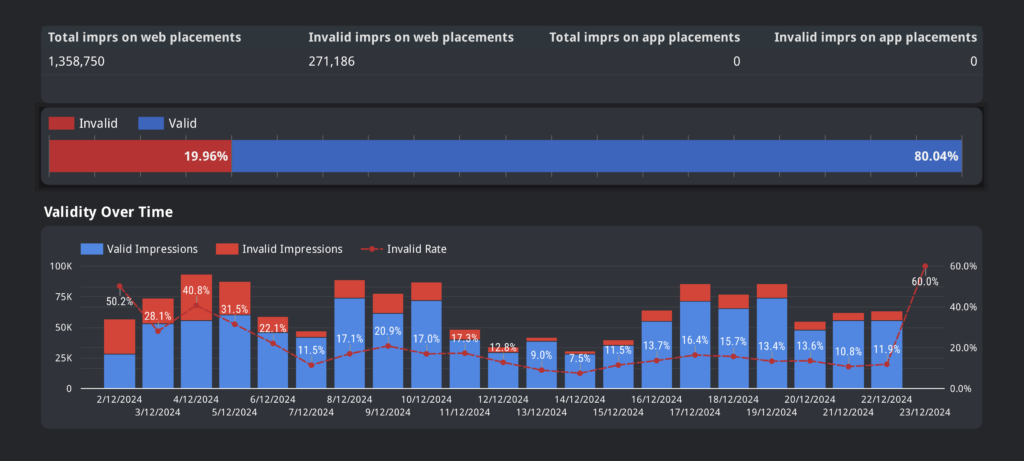
Invalid Impressions: On the Decline
At the start of the campaign, 41% of impressions were invalid. That’s almost half the budget wasted. Through optimization, the invalid rate dropped to 12% over 23 days, proving that filtering and active monitoring make a difference.
Without ongoing intervention, these numbers could easily climb back up. The key takeaway? Junk placements are everywhere. If you don’t actively filter them out, they’ll keep draining your budget.
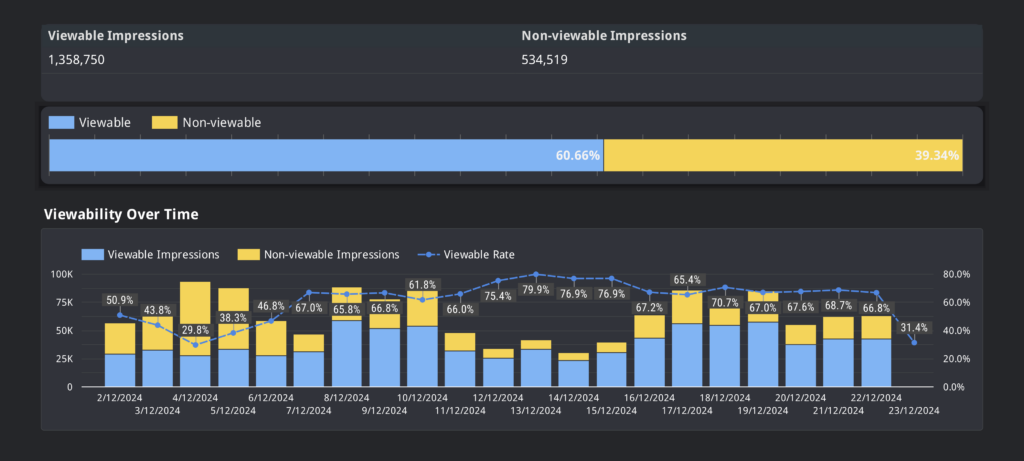
Viewability: Room for Improvement
The campaign’s viewability rate was 61%. While that’s an improvement over time, it’s still below the benchmark of 65%-75%.
This means a significant portion of ads were technically served but likely never seen by a human. If only 61% of impressions are viewable, then nearly 40% of the budget isn’t contributing to brand exposure at all.
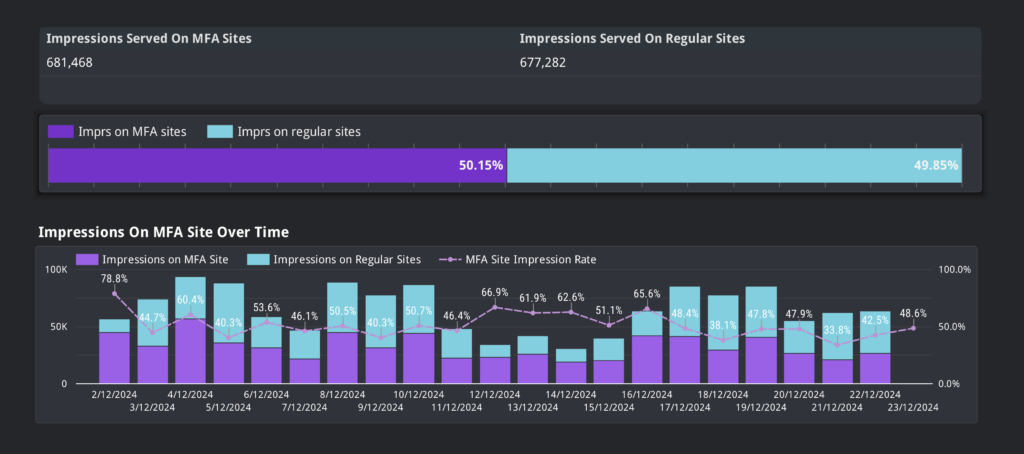
MFA Sites: A Case-By-Case Decision
50% of impressions landed on Made-for-Advertising (MFA) sites. These websites exist mainly to generate ad revenue, often prioritizing ads over actual content. Some premium publishers also get flagged as MFA because this classification is simply a measurement, not necessarily an indication of shady behavior. That’s why advertisers need to check these pages individually and decide how to handle them.
One option could be excluding low-quality MFA sites. Another approach is to analyze if this traffic is actually converting. If an MFA site brings real users who engage, then blocking it might not be the best decision.
Lastly, MFA sites can have human traffic, just as premium publishers can have bot traffic. This is why checking placement quality is crucial. Relying only on automated filters might not be enough.
Pixel Stuffing: A Hidden Challenge in Ad Campaigns
Around 4% of impressions were served in pixel-stuffed placements. These are 0x0 or 1×1 pixel ads, technically counted as impressions but completely invisible to real users. This type of fraud is subtle, but it siphons ad spend away from real audiences. If an advertiser isn’t actively filtering for it, they’re paying for ads that literally no one can see.
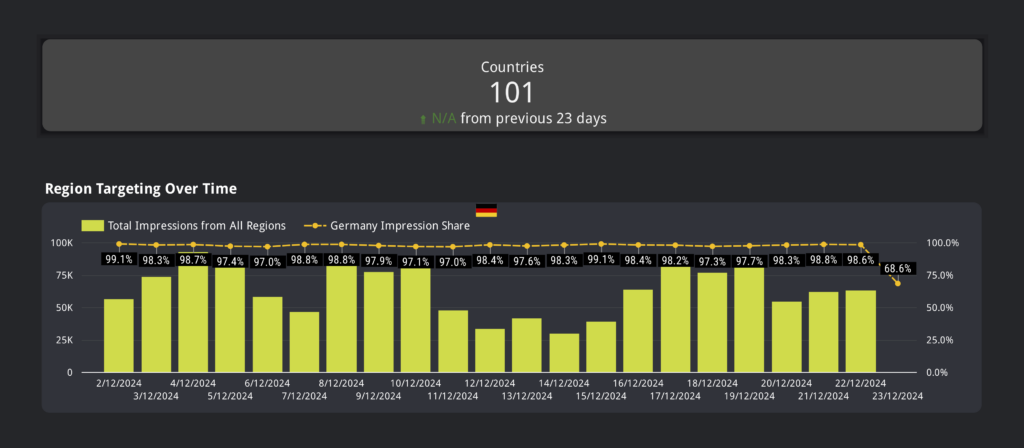
Country Targeting: Almost Perfect
Geo-targeting was 98% accurate, with only 2% of impressions served in non-relevant regions. While that’s a strong result, those 2% still leaked into over 100 different countries. For advertisers with strict targeting requirements, this highlights why even a small percentage of misallocated impressions can be costly.
Optimizing SSPs: Focusing on Quality Over Quantity
The campaign ran across 100 different SSPs (Supply-Side Platforms). That’s too many. More SSPs don’t mean better performance. They often introduce lower-quality inventory and increase exposure to invalid traffic.
More than 11,000 placements delivered over 50% invalid impressions. Half of them even delivered 100% invalid impressions.
What the Advertiser Should Do Next
- Reduce the number of SSPs. Focus on those that deliver brand-safe, human traffic.
- Implement an inclusion list. Instead of blocking bad sites one by one, work with a whitelist of known quality placements.
- Monitor and adjust continuously. Fraud isn’t a one-time fix. Ongoing optimization is key.
Final Takeaway: Data Tells the Story
This example campaign shows why advertisers need transparency and real-time insights. Without checking where their money goes, they risk funding fake impressions, invisible ads, and questionable placements.
If 50% of ads land on MFA sites, 40% of impressions aren’t viewable, and some ads are stuffed into invisible pixels, then the real question is: How much of your ad budget is actually reaching real people?
And this was just a small campaign with 1.4 million ad impressions. Imagine how many invalid impressions and how much wasted money that would mean for the real big campaigns.